Xing Zhou and Khee Yong Lim
Fig. 1 Measured (symbol) and modeled (line) Ids - Vgs curves at the indicated length and bias conditions with minimum and maximum threshold voltages. The full Vt - Ldrawn data [14] is shown in the inset.
Fig. 2 Ids - Vgs characteristics for the L = 0.2-mm device, showing the modeled results before [crosses, Eq. (1)] and after [lines, Eq. (3)] Iedge extraction, compared with the measured data (symbol).
 (b)
(b)
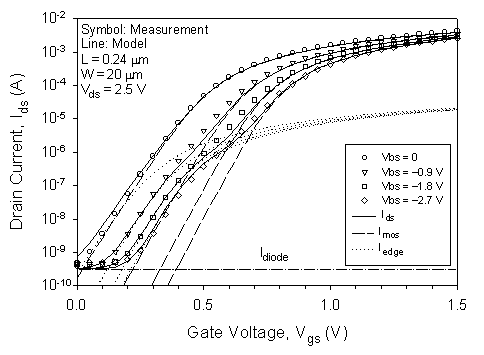
Fig. 3 Prediction of the measured Ids (symbols)
by the modeled Ids (solid lines), which is decomposed
into Imos (dashed lines), Iedge (dotted
lines), and Idiode (dash-dotted lines) for (a) different
channel lengths at fixed biases and (b) different substrate biases at a
fixed channel length.